
Date: January-May 2015
Team Project
My Roles: Developing research questions for interviews and surveys; developing scenarios and personas; conducting interviews and usability tests; contributing to the writing of final reports
Problem: Weather Underground is a forecast provider that aggregates weather data from users whose Personal Weather Stations (PWS) report directly to the organization. Our four-person team’s research focused on two main areas: 1). PWS owners’ motivation to own weather stations and contribute data; 2). and reasons for user attrition.
Process: The team used the following research methods: Interaction Map; Interviews with PWS Owners (including the creation of personas and scenarios); Surveys with PWS owners; Comparative Analysis; Heuristic Evaluation; and Usability Testing.
Deliverables: We wrote 5 reports and created a final video (see below) that summed up findings and recommendations. Reports are available upon request. The entire team collaborated in the analysis and writing of the reports.
Methods
Interaction Map
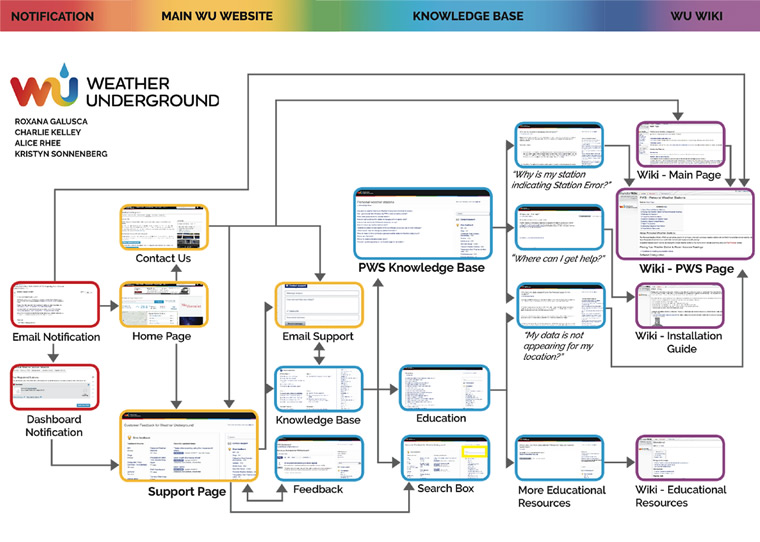
We met as a team and, based on initial client interview, decided to focus on and map Weather Underground’s online support system. Once our task has been established, each team member explored Weather Undeground’s support page to understand a user’s experience, the logic of the entire web layout, and potential inconsistencies.
Our final interaction map is a visual representation of a user’s web browsing process in search of support, including user decision points and process flows.
Interviews, Personas, and Scenarios
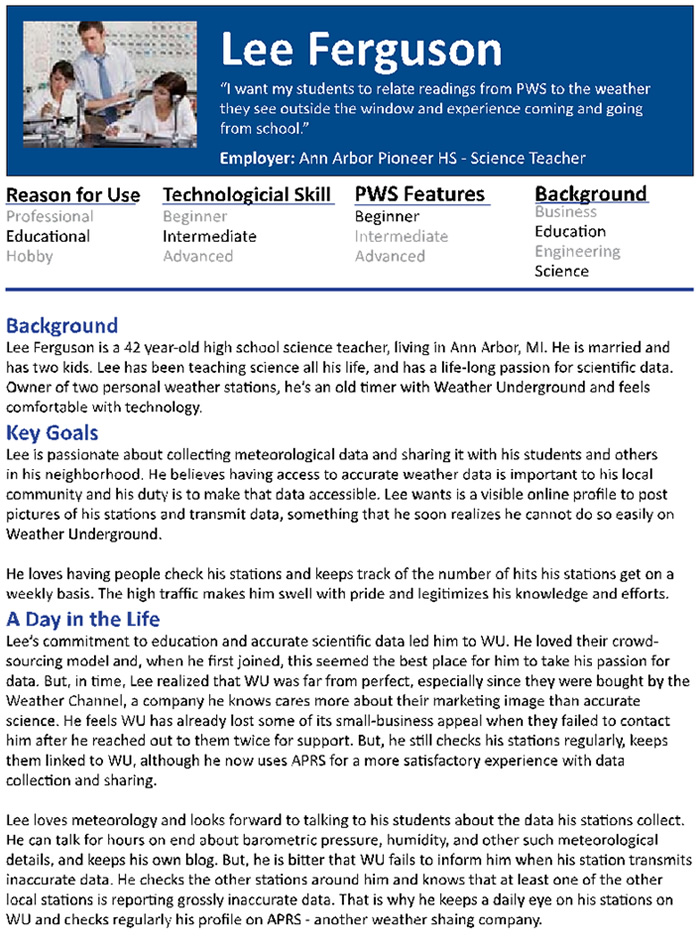
Our team created the interview protocol and conducted five thirty-minute interviews with weather station owners in the Ann Arbor area. Despite the limited number of interviews and the obvious location bias, the interviews yielded insightful stories. We transcribed all the interviews, coded, and analyzed them in preparation for the final report. We also used some of the data to produce three personas and three scenarios.

Surveys
The survey was one of the most exciting parts of this research because of the high rate of user response and interest in our research. Based on themes culled from interviews, we created 41 survey questions in Qualtrics and posted the survey as a banner on Weather Underground’s website, as an opt-in link at the top of randomly selected PWS dashboard pages. The survey was up for 3 days. According to final metrics, 17,051 users saw the invitation link, 752 clicked on it, and 614 users completed our survey. In the end, we had 569 surveys completed by owners of Personal Weather Stations (PWS), our target user population.
To obtain a 95% confidence level and 5% confidence interval for a total user population of 100,000, we needed 383 answered surveys. With 596 returned surveys, we were confident of the statistical significance of our research.

Comparative Analysis
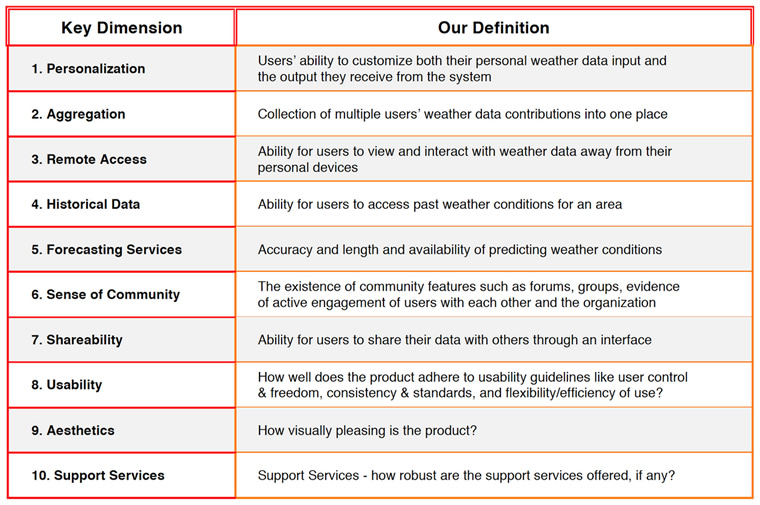
This was a great opportunity for my team to research and analyze similar products on the market and write a detailed report for our client. Drawing on user data compiled from earlier research, we perused several weather forums and, after team discussions, settled on 7 competitors: two direct, 2 parallel, 1 partial, 1 indirect, and 1 analogous. We chose a diverse set of competitors, each having distinct features and services. After brainstorming a list of ten key dimensions defining the user experience, we compiled information about each competitor on a scale of 1 (low accomplishment) to 5 (high accomplishment), with 0 indicating that the dimension was not offered. Because of our focus on user attrition and improvement of support system, key dimensions considered included user account personalization, user’s remote access to data, usability, shareability, and the quality of forecasting services. Our final analysis and report proved extremely useful for the client, giving them important information about their position on the market relative to similar organizations.
Heuristic Evaluation
We used Nielsen’s (1994) usability heuristics to evaluate the support pages on Weather Underground’s website. We decided as a team on a scenario that addressed the real-life steps users need to take to find support on the organization’s website. Following this, each team member evaluated individually the interface and rated the problems found in accordance with established usability principles.
Usability Testing
We conducted 1 pilot and 5 usability tests on Weather Underground’s webpage, using Skype and Google Hangout. Drawing on insights from the Heuristic evaluation and from earlier research, we created three tasks (approximately 7 min each of them in duration), requiring users to use Weather Underground’s Support page to fix a malfunctioning Rapid Fire, upload a new picture on their dashboard, and fix a reporting error with their weather station. Errors were counted against an already established set of success criteria. Each test also included a pre-test and a post-test questionnaire, as well as a final debriefing session with users.
These are some of the findings and recommendations that resulted from our research:
- The Support page is difficult to find, and, once on the Support page, users could not find actionable steps for troubleshooting. We recommend a link to the Support Page at the top of the browser, enabling users to easily find support when needed.
- The organization and structure of the Support page is confusing, which caused users to contact Support directly by phone or to search for answers elsewhere. We recommend more clearly delineating Support page sections.
- Labels and categories on the Support page are not intuitive for users, making site navigation difficult. We recommend renaming some of these categories to reflect users’ own understanding and current web conventions.
- Many users had frequent problems with the software needed to send data from their PWS to Weather Underground. We suggest that Weather Underground provide recommendations about best software packages, including information about user workarounds such as Meteobridge.
- Many PWS owners chose Weather Underground because of their desire to share knowledge and feel part of the weather aficionados community We recommend finding ways to show members that they are valuable members of the community and that their data reporting is important for the community. This includes spotlighting on the Weather Underground webpage the ways in which reported data is being used by other Weather Underground users and facilitating online conversations among PWS owners.
